The following practical example taken from the automotive industry illustrates the effect of a systematical buffer optimization performed with the algorithms implemented in POM Flowline Optimizer. The following graph show the system structure.
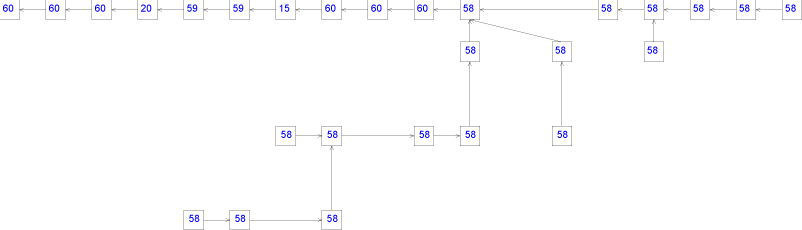
A rectangle represents a station. The number within a rectangle is the deterministic processing time of the station. The stations are subject to random failures with technical efficiencies ranging between 93% and 99%. Each arrow represents a buffer.
At the start of the optimization the planner had no idea how to set the buffers. Without any buffer, the production rate is 0.009008 parts per second. A typical question wihich is equivalent to the primal problem: How many buffers are required in order to achieve a production rate of 0.012 part per second? Using the optimization algorithm implemented in POM Flowline Optimizer, it takes a single second to find the optimum buffer sizes with a total of 34 buffers.
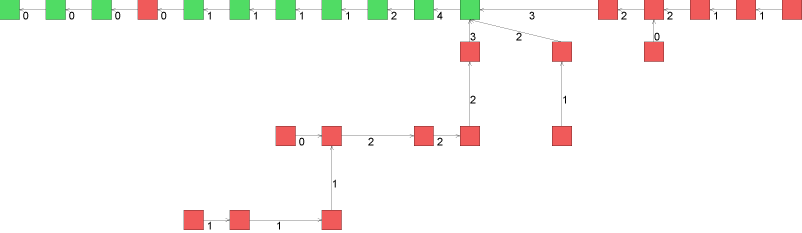
The simulated production rate for this buffer sizes is 0.01215, which is about 1.3% higher than estimated. The stations marked green (red) are primarily starved (blocked).
If the target production rate is set to 0.014 part per second, then the buffer optimisation gives the following buffer allocation with a total of 105 buffers:
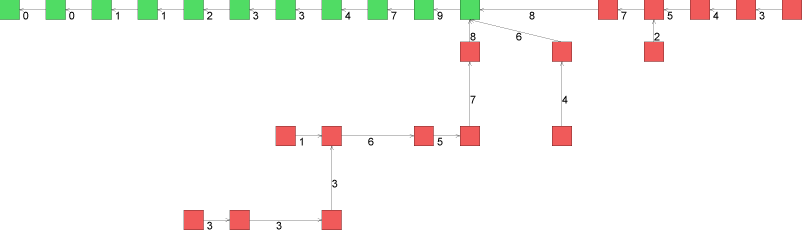
The simulation results are 0.0137 part per second. In this case, POM Flowline Optimizer overestimated the performance of the system by about 2%.
If the target production rate is set to 0.0153 part per second, then the buffer optimisation gives the following buffer allocation with a total of 320 buffers:
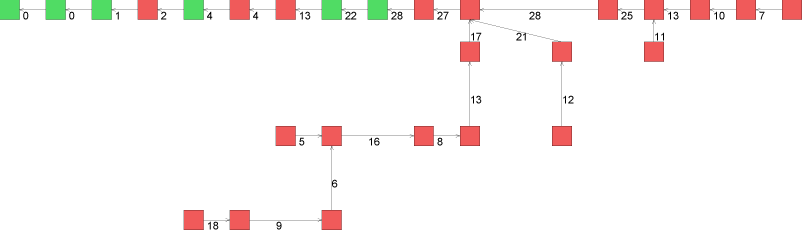
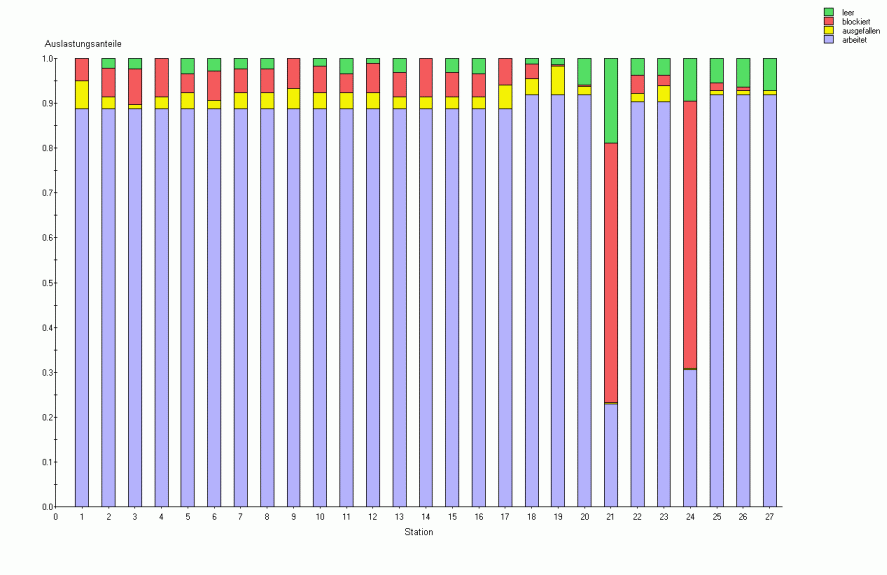
The simulation results are 0.0151 part per second. In this case, POM Flowline Optimizer overestimated the performance of the system by about 1.4%. For this last system alternative, the utilizations are shown in the following figure:
|