
11
Teil XVIII
Qualit¨atssicherung
48 Qualit¨atssicherung
Siehe auch Stevenson (1996)
Tempelmeier (2018), Teil B, Abschnitt 5
48.1 Einf¨uhrung
Qualit¨atsdimensionen
• Vergleich zu einem Standard
• Gebrauchsf¨ahigkeit
• Konsistenz
• Genauigkeitsgrad
Qualit¨atskosten
• Kosten der Feststellung der Qualit¨at
• Kosten der Vermeidung und Beseitigung schlechter Qualit¨at
• Ausfallkosten
a) Interne Ausfallkosten
b) Externe Ausfallkosten
289

Fehlertypen
Fehler vom Typ I:
• Ablehnung der (guten) Grundgesamtheit, obwohl sie zufriedenstellend ist. Die
Ablehnung einer guten Grundgesamtheit f¨uhrt zu unn¨otigen Kosten f¨ur den Liefer-
ant en (Produzentenrisiko).
Fehler vom Typ II:
• Annahme der (schlechten) Grundgesamtheit, obwohl sie nicht zufriedenstellend ist.
Die Annahme einer schlechten Grundgesamtheit f¨uhrt zu unn¨otigen Kosten f¨ur den
Abnehmer (Abnehmerrisiko).
Fragen
1. Was soll kontrolliert werden?
2. Wie soll es kontrolliert werden?
3. Wann soll kontrolliert werden?
4. Wo soll kontro lliert werden?
48.2 Abnahmepr¨ufung
Variablen eines Pr¨ufplans
• Stichprobenumfang n
• Akzeptanzgrenze c
AQL, LTPD
• AQL (acceptable quality level) betrifft durchschnittliche Qualit¨at
• LTPD (lot tolerance percent defective) betrifft Streuung
290
Variablen der Abnahmepr¨ufung
Variablen
N Losgr¨oße (Grundgesamtheit)
n Stichprobenumfang
x Anzahl gefundener defekter Teile
c Annahmegrenze
Entscheidungsregel
• wenn x > c, dann Ablehnung des Loses;
• wenn x ≤ c, dann Annahme des Loses.
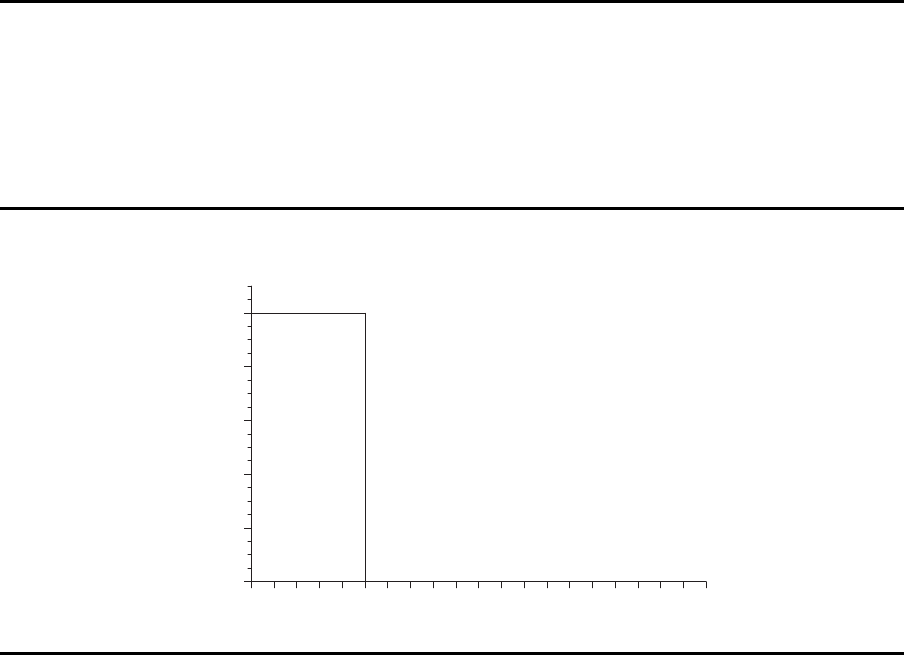
OC-Kurve
OC(p) = P {Annahme des Loses | Anteil defekter Teile = p}
Ideale OC-Kurve
0.0
0.2
0.4
0.6
0.8
1.0
Annahmewahrscheinlichkeit
p
1
=AQL
Anteil p defekter Teile (Prozent)
gut
(akzeptieren)
schlecht
(ablehnen)
291
Realisierbare OC-Kurve
0.0
0.2
0.4
0.6
0.8
1.0
A
n
n
a
h
m
e
w
a
h
r
s
c
h
e
i
n
l
i
c
h
k
e
i
t
0 5 10 15 20 25 30 35 40 45 50 55 60
Anteil p fehlerhafter Teile (Prozent)
Produzentenrisiko α
(Ablehnungswahrscheinlichkeit
eines guten Loses)
Abnehmerrisiko
β
(Annahmewahrscheinlichkeit
eines schlechten Loses)
p
1
=AQL p
2
=LTPD
gut
schlecht
unbestimmt
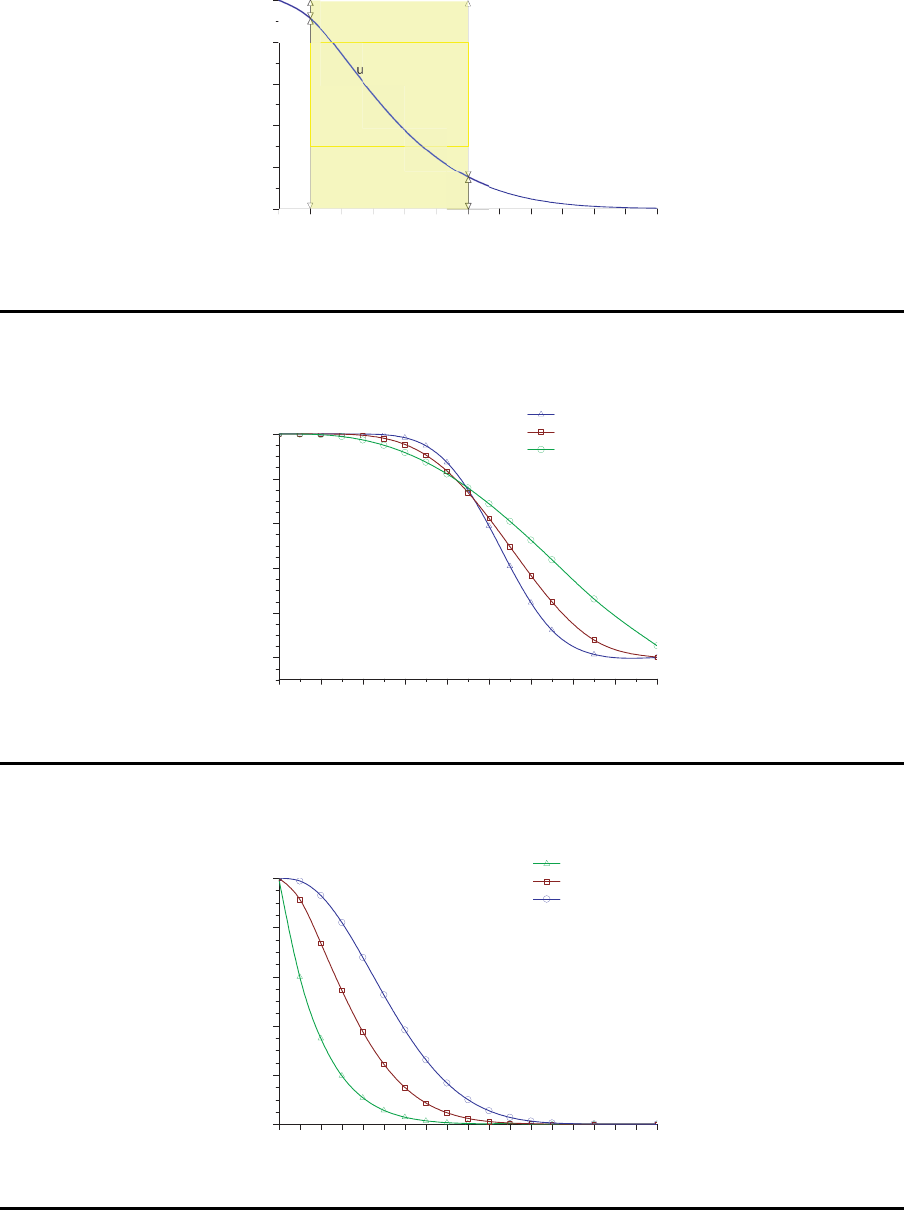
OC-Kurven bei konstantem n/c
0.0
0.2
0.4
0.6
0.8
1.0
A
n
n
a
h
m
e
w
a
h
r
s
c
h
e
i
n
l
i
c
h
k
e
i
t
0 10 20 30 40 50 60 70 80 90
Anteil p fehlerhafter Teile (Prozent)
n=20, c=10
n=10, c=5
n=4, c=2
Relation n/c ist konstant
OC-Kurven mit variablem c und konstantem n
0.0
0.2
0.4
0.6
0.8
1.0
A
n
n
a
h
m
e
w
a
h
r
s
c
h
e
i
n
l
i
c
h
k
e
i
t
0 5 10 15 20 25 30 35 40 45 50 55 60 65 70 75 80 85 90
Anteil p fehlerhafter Teile (Prozent)
n=10, c=0
n=10, c=1
n=10, c=2
c variabel/n konstant
292

OC-Kurven mit variablem c und variablem n
0 0.05 0.1 0.15 0.2
0
0.25
0.5
0.75
1
P{ANNAHME}
0 0.05 0.1 0.15 0.2
0
0.25
0.5
0.75
1
P{ANNAHME}
0 0.05 0.1 0.15 0.2
0
0.25
0.5
0.75
1
P{ANNAHME}
0 0.05 0.1 0.15 0.2
0
0.25
0.5
0.75
1
P{ANNAHME}
0 0.05 0.1 0.15 0.2
0
0.25
0.5
0.75
1
P{ANNAHME}
0 0.05 0.1 0.15 0.2
0
0.25
0.5
0.75
1
P{ANNAHME}
0 0.05 0.1 0.15 0.2
0
0.25
0.5
0.75
1
P{ANNAHME}
0 0.05 0.1 0.15 0.2
0
0.25
0.5
0.75
1
P{ANNAHME}
0 0.05 0.1 0.15 0.2
0.2
0.3
0.4
0.5
0.6
0.7
0.8
0.9
1
P{ANNAHME}
0 0.05 0.1 0.15 0.2
0
0.25
0.5
0.75
1
P{ANNAHME}
0 0.05 0.1 0.15 0.2
0
0.25
0.5
0.75
1
P{ANNAHME}
0 0.05 0.1 0.15 0.2
0
0.25
0.5
0.75
1
P{ANNAHME}
0 0.05 0.1 0.15 0.2
0.4
0.5
0.6
0.7
0.8
0.9
1
P{ANNAHME}
0 0.05 0.1 0.15 0.2
0.1
0.2
0.3
0.4
0.5
0.6
0.7
0.8
0.9
1
P{ANNAHME}
0 0.05 0.1 0.15 0.2
0
0.25
0.5
0.75
1
P{ANNAHME}
0 0.05 0.1 0.15 0.2
0
0.25
0.5
0.75
1
P{ANNAHME}
Bestimmung von c und n
P
a
(p
1
) = 1 − α
P
a
(p
2
) = β
Beispiel:
Grundgesamtheit N=10000 (d. h. sehr groß )
Produzentenrisiko α = 0.05
Akzeptanzgrenze AQL p
1
= 0.01
Abnehmerrisiko β = 0.10
Toleranzschwelle LTPD p
2
= 0.08
Bestimmung von c und n
a) F¨ur Lose mit einem Fehleranteil von AQL= p
1
= 0.01 muß gelten:
P
a
(p
1
) = 0.95
Ein Los wird immer dann angenommen, wenn die Anzahl der gefundenen fehler-
haften Teile, x, die Annahmegrenze c nicht ¨uberschreitet.
P {x ≤ c |p
1
} =
= P {x = 0 |p
1
} + P {x = 1 |p
1
} + . . . + P {x = c |p
1
} = 0.95
293
Bestimmung von c und n
b) F¨ur Lose mit einem Fehleranteil von LTPD= p
2
= 0.08 muß gelten:
P
a
(p
2
) = 0.10
P {x ≤ c |p
2
} =
= P {x = 0 |p
2
} + P {x = 1 |p
2
} + . . . + P {x = c |p
2
} = 0.10
Binomialverteilung
P {x = k |p} = b(x; n, p)
b(x; n, p) =
n!
x! · (n − x)!
·p
x
· ( 1 − p)
n−x
P
a
= P {x ≤ c} =
c
X
x=0
n!
x! ·(n −x)!
· p
x
· ( 1 − p)
n−x
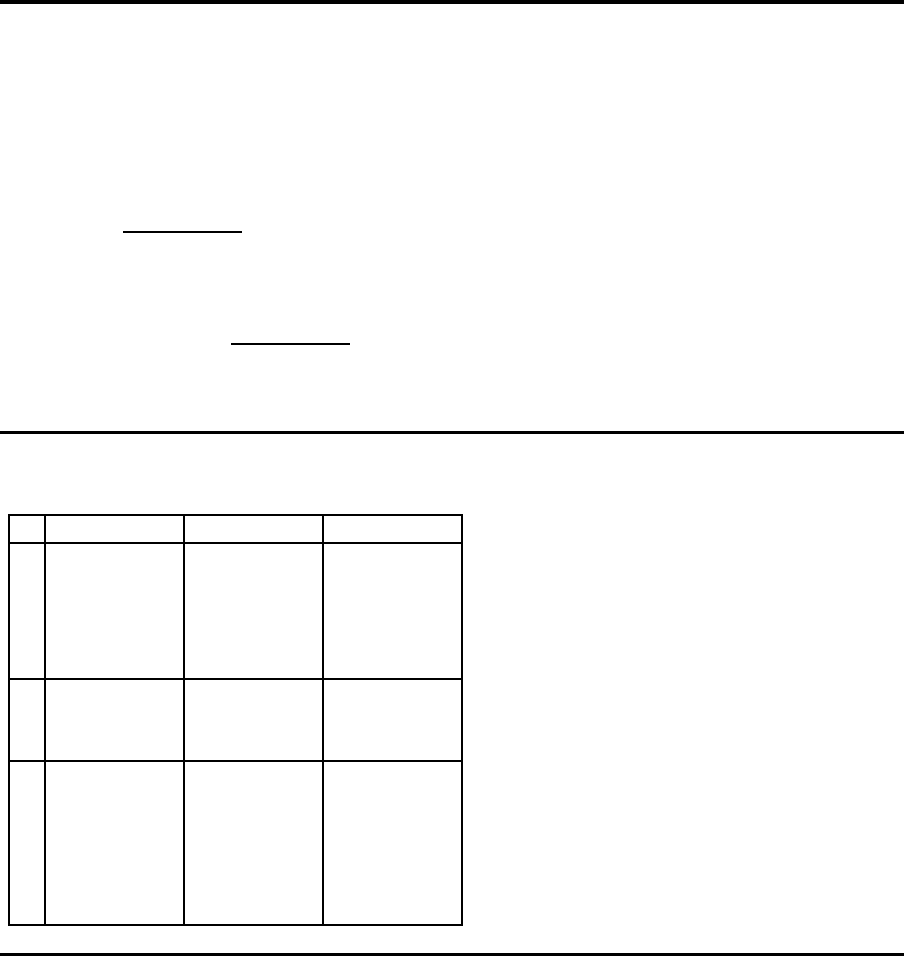
Bestimmung von c und n
c n 1 −α β
0 40 0.6690
30 0.7397
10 0.9044
6 0.9415
5 0.9510 0.6591
1 40 0.9393
38 0.9445
36 0.9497 0.2184
2 40 0.9925
50 0.9862
60 0.9776
70 0.9667
80 0.9534
82 0.9505 0.0357
294
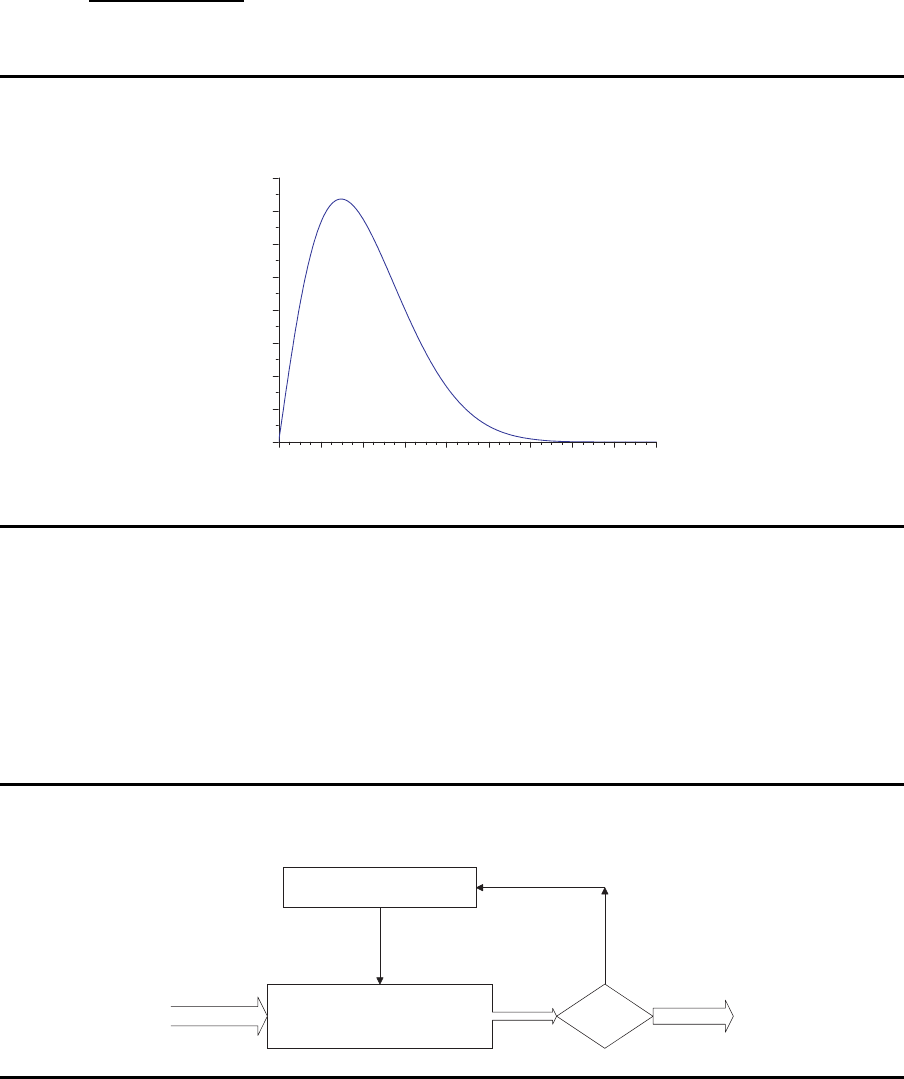
AOQ
Average Outgoing Quality
AOQ =
P
a
· p · (N − n)
N
AOQ
0
1
2
3
4
5
6
7
8
m
ittlerer Anteil fehlerhafter Teile (Prozent)
0 10 20 30 40 50 60 70 80 90
Anteil p fehlerhafter Teile (Prozent)
N=100
n=10
OC-Kurve mit n=10 und c=1
ATI
AT I = n + (1 − P
a
) · (N − n)
48.3 Prozeßkontrolle
Regelkreis
Produktionsprozeß
?
Material
Anpassungs-
maßnahmen
Endprodukte
295
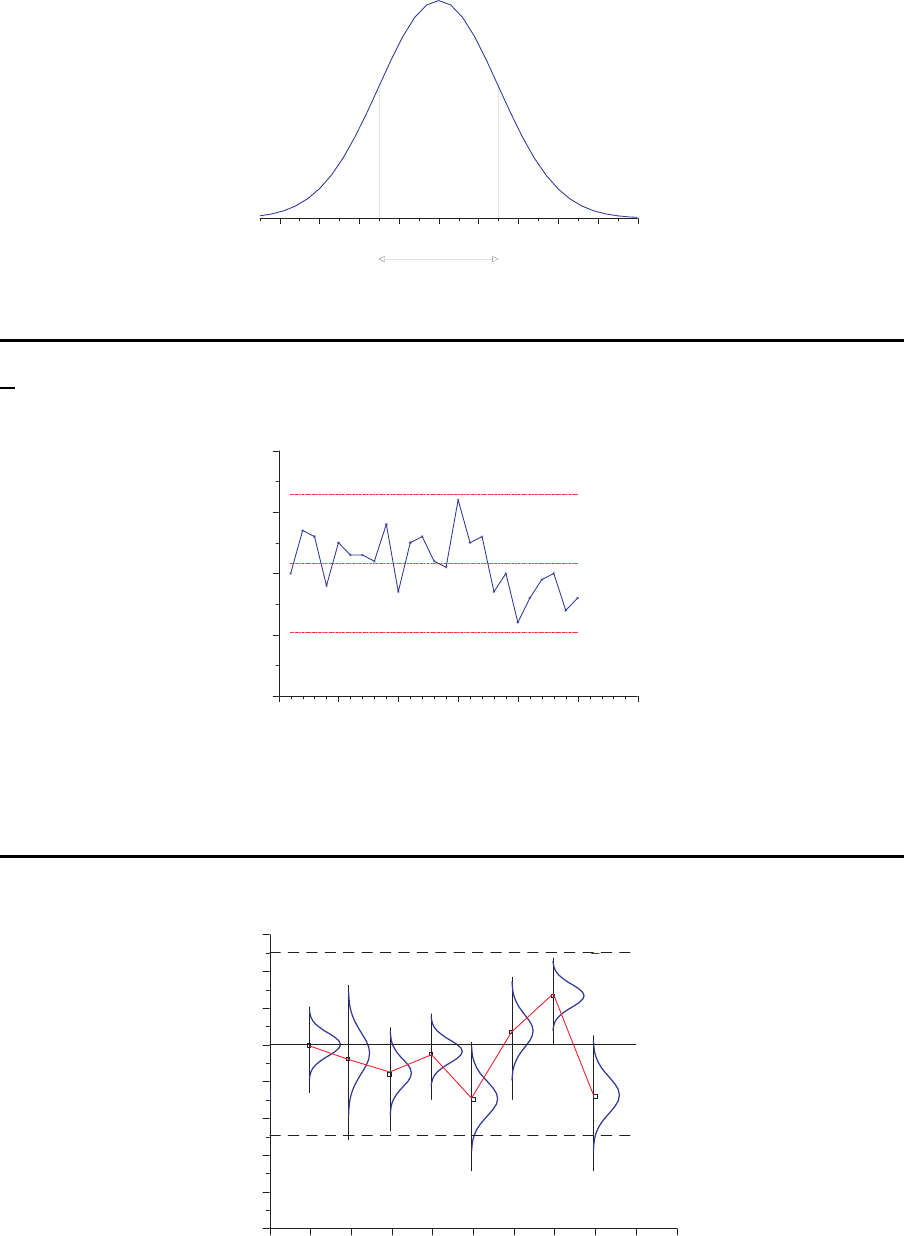
Normalverteilung
0.2520 0.2530 0.2540 0.2550 0.2560 0.2570 0.2580 0.2590 0.2600 0.2610
µ
µ−σ
µ+σ
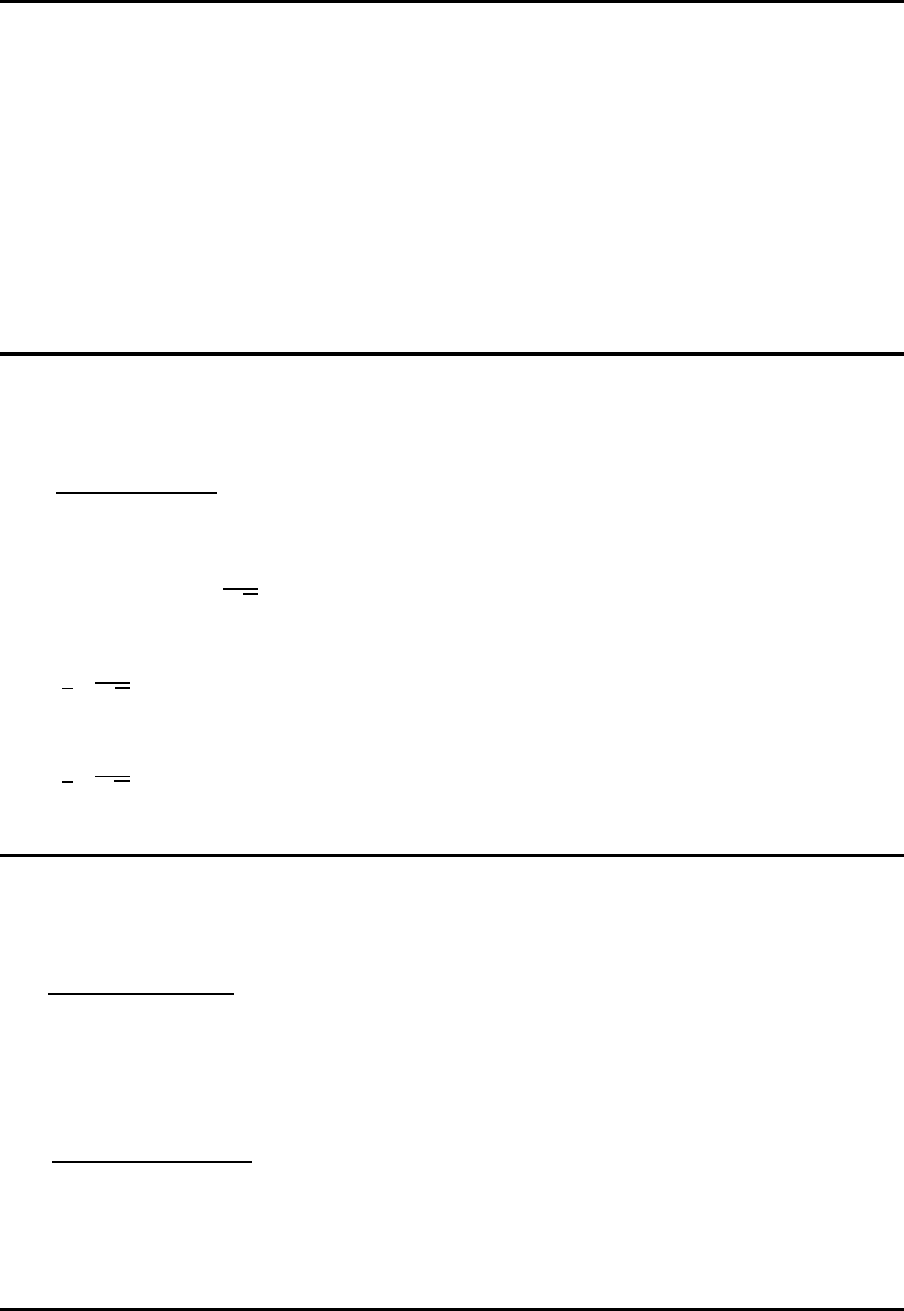
x-Karte
0.5
0.6
0.7
0.8
0.9
Durchm
esser
0 5 10 15 20 25 30
Stichprobe
UCL=0.83
MID=0.72
LCL=0.60
NOTE: Nonstandard Confidence Percent used: 99.900
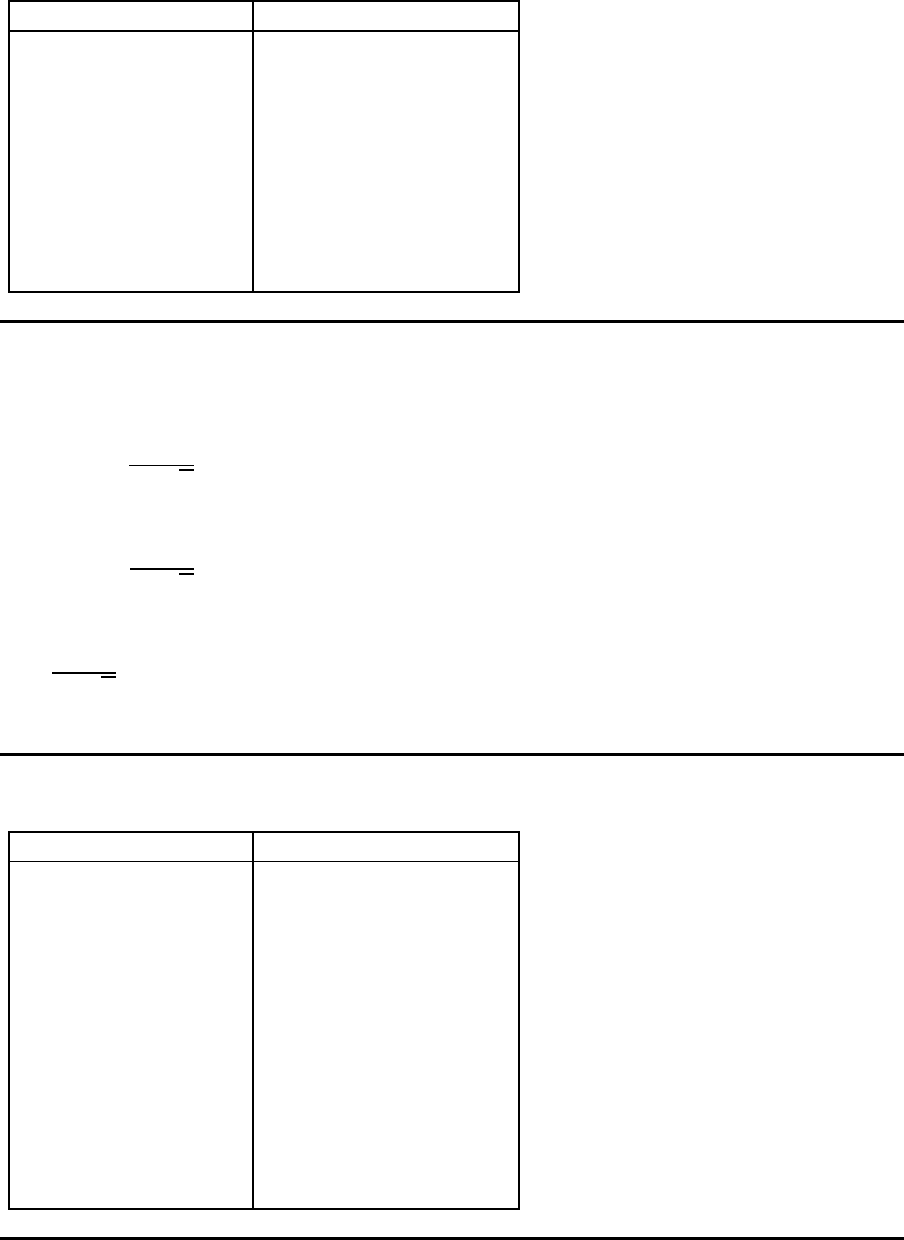
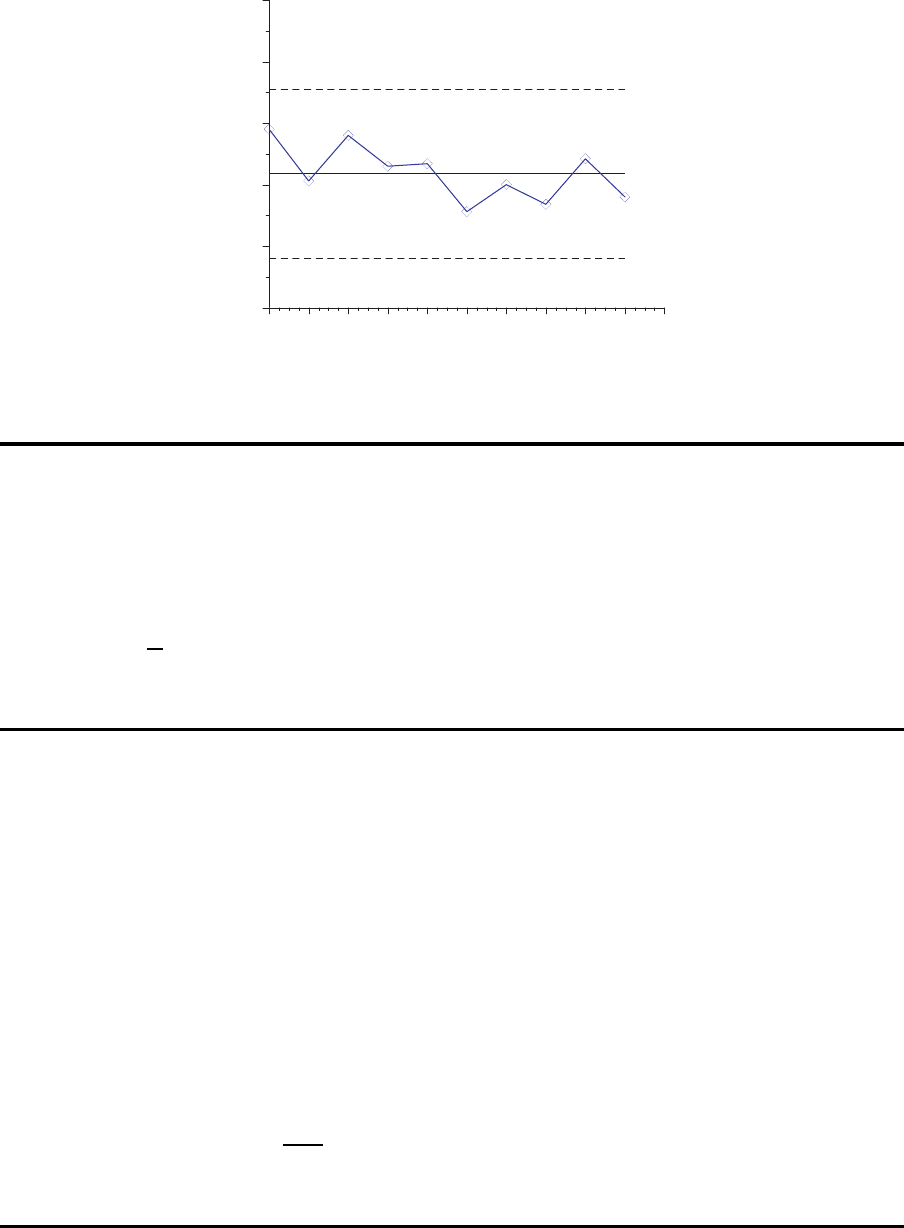
48.3.1 Kontrollkarten f¨ur Mittelwerte
Prozeßkontrolle
8
9
10
11
12
13
14
15
16
Durchmesser
1 2 3 4 5 6 7 8 9 10 11
Stichprobe
UCL
MID
LCL
296
Symbole
µ tats¨achlicher Mittelwert des Prozesses (u. U. nicht bekannt)
σ tats¨achliche Standardabweichung d es Prozesses (u.U. nicht bekannt)
j Index der Stichproben
n Stichprobenumfang
¯x
j
Mittelwert der Stich probe j
s
j
Standardabweichung der Stichprobe j
¯
¯x Mittelwert der Stichprobenmittelwerte
σ
¯x
Standardabweichung der Stichprobenmittelwerte
µ und σ des Prozesses bekannt
¯x
j
=
x
1
+ x
2
+ ···x
n
n
¯x
j
⇒ N
µ,
σ
√
n
µ − Z
α
2
·
σ
√
n
µ + Z
α
2
·
σ
√
n
µ und σ des Prozesses sind nicht bekannt
¯
¯x =
¯x
1
+ ¯x
2
+ ··· + ¯x
J
J
R
j
=
x
max
j
− x
min
j
¯
R =
R
1
+ R
2
+ ··· + R
J
J
¯
R = a · σ
297
Stichprobenumfang n a (bzw. d
2
)
2 1.128
3 1.693
4 2.059
5 2.326
6 2.534
7 2.704
8 2.847
9 2.970
10 3.078
Berechnung der Konstanten A
OCL =
¯
¯x +
3
a ·
√
n
·
¯
R
UCL =
¯
¯x −
3
a ·
√
n
·
¯
R
A =
3
a ·
√
n
Stichprobenumfang n A
2 1.880
3 1.023
4 0.729
5 0.577
6 0.483
7 0.419
8 0.373
9 0.337
10 0.308
12 0.266
14 0.235
16 0.212
298
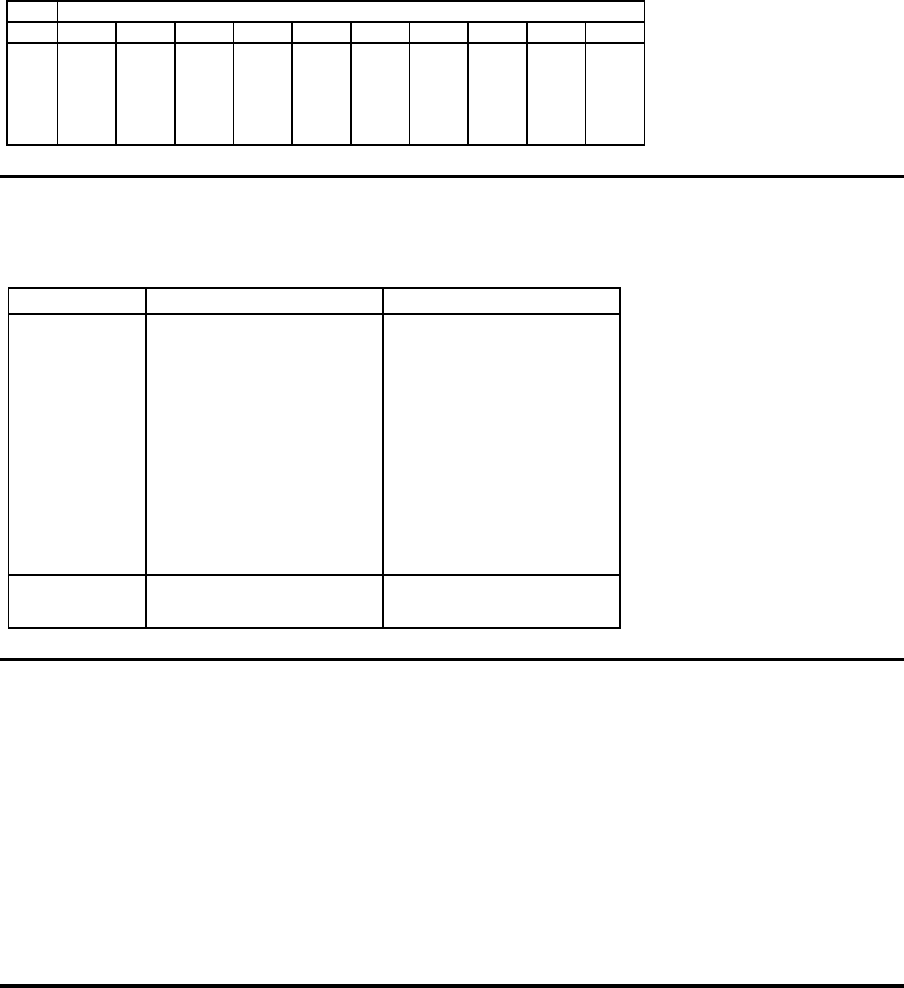
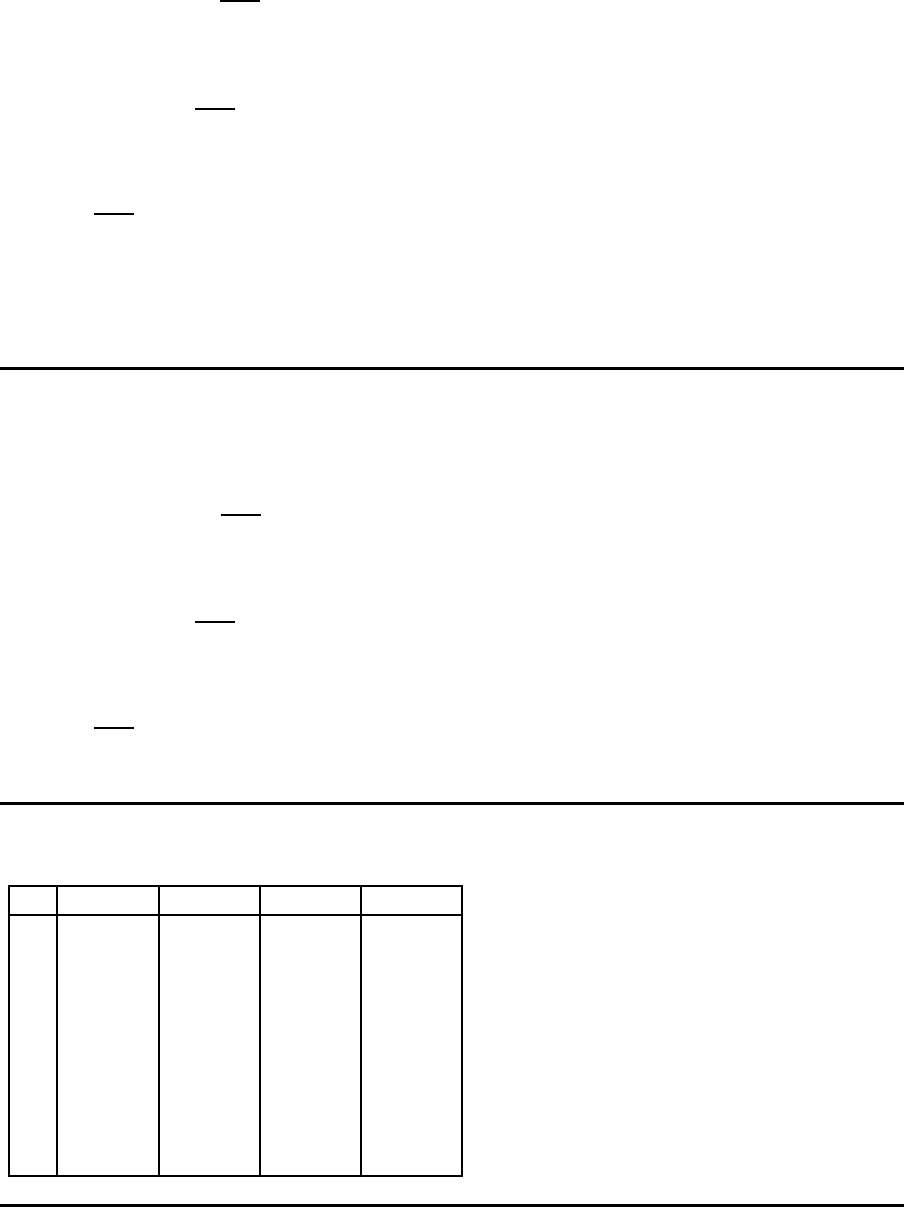
Beispiel
Daten
Stichprobe
Beob. 1 2 3 4 5 6 7 8 9 19
1 74.03 73.995 73.988 74.002 73.992 74.009 73.995 73.985 74.008 73.998
2 74.002 73.992 74.024 73.996 74.007 73.994 74.006 74.003 73.995 74.000
3 74.019 74.001 74.021 73.993 74.015 73.997 73.994 73.993 74.009 73.990
4 73.992 74.011 74.005 74.015 73.989 73.985 74.000 74.015 74.005 74.007
5 74.002 74.004 74.002 74.009 74.014 73.993 74.005 73.988 74.004 73.995
Beispiel
Auswertung
Stichprobe j Mittelwert Spannweite
1 74.0090 0.03800201
2 74.0006 0.01900482
3 74.0080 0.03600311
4 74.0030 0.02200317
5 74.0034 0.02600098
6 73.9956 0.02400208
7 74.0000 0.01199341
8 73.9968 0.02999878
9 74.0042 0.01399994
10 73.9980 0.01700592
Mittelwerte: 74.00186 0.02380142
=
¯
¯x =
¯
R
Beispiel
OCL
x
= 74.00186 + 0.577 ·0.023 8
= 74.00186 + 0.0137326
= 74.015593
UCL
x
= 74.00186 − 0.577 · 0.0238
= 74.00186 − 0.013732 6
= 73.988127
Beispiel
299
73.98
73.99
74.00
74.01
74.02
74.03
Durchmesser
1 2 3 4 5 6 7 8 9 10 11
UCL=74.02
MID=74.00
LCL=73.99
48.3.2 Kontrollkarten f¨ur Spannweiten
Standardabweichung der Spannweite
σ
R
= b ·σ
σ
R
= b ·σ
¯x
·
√
n
OCL
R
=
¯
R
|{z}
a·σ
+3 · σ
R
|{z}
b·σ
OCL
R
= a ·σ + ·3b · σ
a · σ + 3 · b ·σ = σ ·(a + 3 ·b)
σ · (a + 3 · b) = a · σ ·
1 +
3 · b
a
300
Obere Kontrollgrenze
OCL
R
= a ·σ ·
1 +
3 · b
a
=
¯
R ·
1 +
3 · b
a
B = 1 +
3 · b
a
UCL
R
=
¯
R −3 ·σ
R
Untere Kontrollgrenze
UCL
R
= a ·σ ·
1 −
3 · b
a
=
¯
R ·
1 −
3 · b
a
C = 1 −
3 · b
a
a, b, B, C
n a b B C
2 1.128 0.853 3.269 0
3 1.693 0.888 2.574 0
4 2.059 0.880 2.282 0
5 2.326 0.864 2.114 0
6 2.534 0.848 2.004 0
7 2.704 0.833 1.924 0.0 76
8 2.847 0.820 1.864 0.1 36
9 2.970 0.808 1.816 0.1 84
10 3.078 0.797 1.777 0.2 23
301
Beispiel
OCL
R
= 0.0238 · 2.114 = 0.0503
UCL
R
= 0.0238 · 0 = 0
Literatur
Domschke, W. and A. Drexl (2005). Einf¨uhrung in Operations Research (6. ed.). Berlin:
Springer.
G¨unther, H.-O. and H. Tempelmeier (2016). Produktion und Logistik (12. ed.). Norder-
stedt: Books on Demand.
Helber, S. (2014). Operations Mana gement Tutorial. Leipzig: Stefa n Helber.
Kalczynski, P. and J. Kamburowski (2007). On the NEH heuristic for minimizing the
makespan in permutation flow shops. Omega 35, 53–60.
Stevenson, W. J. (1996). Production/Operations Management. Chicago: Irwin.
Tempelmeier, H. (2017). Produktionsplanung in Suppl y Chains (5 . ed.). Norderstedt:
Books-on-D emand.
Tempelmeier, H. (2018). Supply Chain Management und Produktion –
¨
Ubungen und
Mini-Fallstudien (6. ed.). Norderstedt: Books on Demand.
Tempelmeier, H. and H. Kuhn (1993). Flexible Fertigungssysteme – Entscheidungsun-
terst¨utzung f¨ur Konfiguration und Betrieb. Berlin: Springer.
302